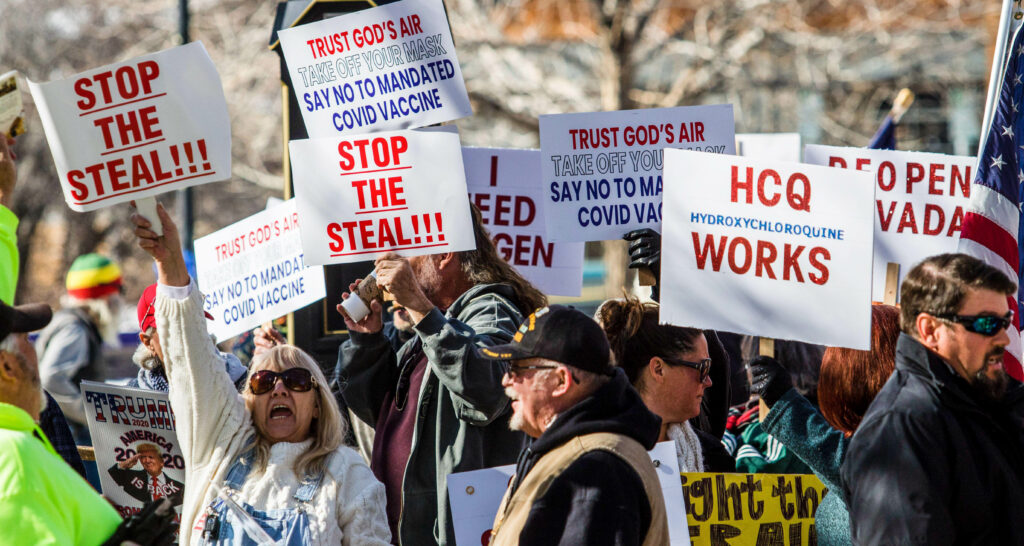
Tackling the fake news ‘infodemic’: COVID-19 and beyond
Improvements in technology have made information more accessible than ever. Then why has public debate in recent years been overrun with false narratives, and what can be done?
Data and monitoring — Europe, Global, US and Canada
Today, the information that enables our day-to-day decisions is plentiful and accessible. Before the pandemic, I had a 50-minute commute to work by either bicycle or subway. To decide which mode of transportation was best, I checked the weather app on my phone to see if the daily forecast was conducive for biking. If the weather looked dodgy, I then reviewed the subway app to see if there were service delays. Based on these two sources, I either jumped on my bike or headed to the metro station.
What made me rely on these sources for my commuting decisions? First, the information mattered to my decision. Second, with nearly daily use, I came to trust these sources as reliable. Third, their information was up to date: both sources updated their data and analysis in near real time. Fourth, the data was easily accessible: from the simple touch of my phone, I could easily pull up the apps. Finally, the presentation of the information made it a snap to absorb: their graphs and maps provided a convenient summary of the data. All it took was a glance at my phone to make my decision.
Yet, if reliable and trustworthy information has become easier to consume, why has public debate often been overrun by false narratives? And most recently, what factors contributed to the COVID-19 pandemic becoming an ‘infodemic’: a global outbreak of misinformation?
The data does not fit with what people see or feel
Nobel prize-winning economist Joseph Stiglitz believes that, “if what the expert says has little or no relation to what people feel or can see all around them, it’s inevitable that they stop believing the experts and look for answers elsewhere.” The 2008 financial crisis offers a clear example. During this time, gross domestic product (GDP), the standard-bearer for measuring country output, incomes and welfare for over 60 years, continued to grow steadily. But GDP did not reflect that the majority of people were worse off and, in the US, that nearly 91% of the gains went to the top 1%. Moreover, GDP also did not capture that the crisis caused a permanent loss of ‘hidden capital’ in the form of reduced on-the-job training, weaker career prospects for younger workers, and a growing sense of economic insecurity. As some economists relied almost exclusively on GDP to report on the economy’s health, people’s trust in both the experts and in the statistics was undermined.
The COVID-19 pandemic provides a more recent example of this phenomenon. By July 2020, 45% of the recorded 125,000 COVID-19 deaths were in just four US states: New Jersey, New York, Massachusetts and Illinois. By contrast, 25 states had lost a combined total of 8,000 people, 6.4% of the national total. Four states (Alaska, Hawaii, Wyoming and Montana) had only 80 reported deaths. Although travel between states was never fully restricted, the lack of day-to-day encounters with the disease encouraged indifference in states with a low prevalence of deaths in adopting social distancing and quarantine measures. As a result, a surge in cases and deaths nearly overwhelmed many of these states in the latter half of 2020.
Fortunately, steps are being taken to develop measures that fit better with what people see and feel. For example, the disconnect between GDP and the true impact of the economic crisis led the Organisation for Economic Co-operation and Development to create a high-level group to develop data sets and tools to examine factors that matter most to people. And the US Centers for Disease Control is rolling out V-safe, a mobile phone app that collects data on symptoms from the recently vaccinated. Presenting V-safe data in compelling ways will be important for demonstrating to the public how few people are experiencing adverse effects and encouraging greater vaccination take-up among those who remain distrustful of the vaccine.
Fact-checking is not always seen as impartial
The proliferation of false narratives in public discourse has made fact-checking a staple of news reporting services.The New York Times, The Washington Post and the BBC are well-known examples. Recent research tested the impact of fact-checking on public opinion. While it showed that it does indeed improve the public’s factual knowledge, increased factual knowledge is insufficient to change policy positions or politicians who support these positions.
One possible reason for this can be attributed to the current state of news media. Media outlets play multiple roles: they report on news as objectively as possible, they fact-check statements made in the public domain, and they provide commentary on these issues. Some researchers have found that the media’s multiple roles undermine trust in fact-checking. And the problem has only worsened in recent years as news distribution has shifted from traditional print to digital (online and social media). Digital distribution allows for highly efficient micro-targeting, limiting users to challenge the content.
Further, anyone with a ‘following’ or ‘klout’ can comment on a statement and claim it’s incorrect when in reality it’s true. Finally, digital media organisations are under so much pressure to get the story out ahead of competitors that they are forced to publish urgently to get the exclusive. Traditional print sources would have had more time to fact-check and validate sources. To combat the spread of misinformation via digital channels, the UN recently launched its PAUSE campaign to encourage social media users to reflect before they share content.
Fact-checking may have more impact if it comes from within the public sector. For instance, the Head of the UK Statistics Authority (UKSA) is legally empowered to call out politicians when facts and figures are misused in reports and speeches. This prerogative works because the UKSA reports to the UK Parliament rather than the Prime Minister and is perceived as an impartial figure. The UKSA recently made the news when the UK government misled the public over the number of COVID-19 tests it carried out. The UKSA, however, is careful to not overstep. It believes that selective use of factual statistics is part of the political discourse, and careful judgement is applied to determine when selectivity crosses over to misuse or misleading facts.
Information providers need to be upfront about the limitations of their measures
When experts at John Hopkins University created a dashboard and interactive map to track the spread of COVID-19, little did they know that it would quickly become the world’s most authoritative source on the latest coronavirus numbers and trends, with the dashboard receiving upwards of 1.2 billion requests daily. For the US, the dashboard used data gathered by the COVID Tracking Project. Recently, the project’s creators described the challenges they faced in compiling comprehensive and reliable data across the US. They observed that, “before March 2020, the US had no shortage of pandemic preparation plans. Many of these plans stressed the importance of data-driven decision-making. Yet these plans largely assumed detailed and reliable data would simply exist.”
Unfortunately, this was not the case. The project devoted much effort to adjusting state-level data to ensure that they were comparable at the national level. Had state-level data providers routinely provided metadata (information that describes how and what their data reflect), steps could have been taken before the pandemic to create a consistent set of statistics and allowed policymakers to act sooner.
Doing better next time
The indicators underlying the Sustainable Development Goals have been developed through an inclusive consultative process to ensure that these statistics are policy-relevant and consistently measured by 195 countries. Yet, technical challenges remain to provide numbers for small geographic areas and for vulnerable population groups. At SDSN TReNDS, we have a mandate to get a range of actors (including statisticians, policymakers, data scientists and lawmakers) to work together to overcome these challenges. The resulting information, we believe, will provide a solid foundation for fighting false narratives on development progress.
Related articles

Global governance needs reshaping if we’re to achieve the SDGs
The pandemic has painfully exposed many societies’ inability to deal with crises. We must urgently innovate and democratize our governance structures if we’re to thwart the existential threats facing humankind

The world needs a new, constructive multilateralism to achieve the SDGs
The last four years have seen a fractured and antagonistic approach to global affairs. What are the prizes to be gained from global leaders working together towards common goals? Is a new era possible?
